Handy Pocket Guide to EKG Interpretation
1. Rhythm (sinus?)
Are P-waves upward in leads I, II and downward in aVR?
Is there a P for every QRS, and a QRS for every P?
- Yes to above two → sinus rhythm.
2. Rate
Count the number of big boxes between two consecutive R waves. Divide 300 by this number.
e.g., 3 big boxes → 300 / 3 → 100bpm.
Can help to remember this sequence while counting: 300, 150, 100, 75, 60, 50 ...
Is the R-R distance regular, regularly irregular, or irregularly irregular?
Regularly irregular: think heart block (2nd degree, Mobitz type II?)
-
Irregularly irregular:
- Not sinus → consider Afib, Aflutter, other SVTs? (read more here)
- Sinus → consider sinus arrhythmia?
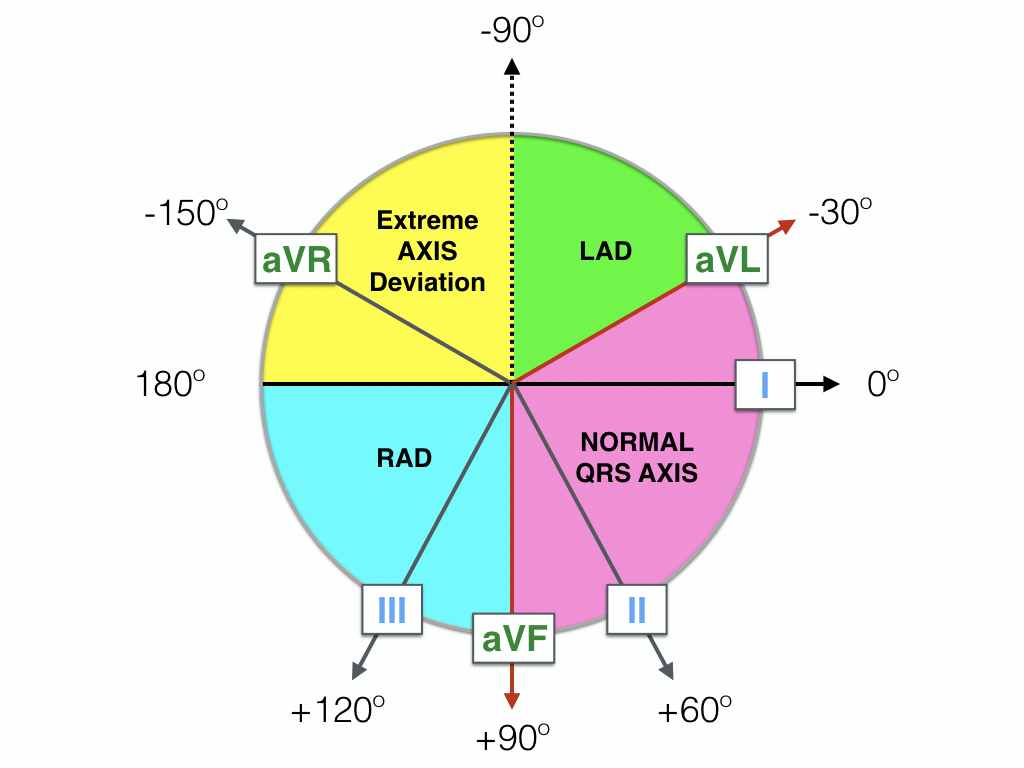
3. Axis
Check if R > S (positive) in I and aVF.
- If positive in both leads → normal axis.
- If I is negative and aVF is positive → R axis deviation.
- If I is positive and aVF is negative, then take a look at lead II. If R > S, then it is normal axis. If R < S, then it is L axis deviation.
Axis diagram
4. Intervals
a) PR (normal: 0.12 – 0.2 sec)
- If PR is too long, think: Heart Block?
- If PR is too short, think: accessory conduction pathway (WPW)? (can you see delta waves?)
b) QRS (normal: <0.12 sec)
- If QRS is too wide, think: Bundle branch block/pacemaker? Idioventricular rhythm?
c) QTc (0.33 – 0.47 sec)
- Is there a prolonged QT?
- Quick and dirty for prolonged QT is if the end of T is past the halfway mark between the R-R interval, then QT is prolonged.
5. Morphology
a) MAT - Multifocal Atrial Tachycardia
- Look for at least 3 morphologically distinct P waves, irregular P-P intervals, and an isoelectric baseline between the P waves.
b) Atrial Enlargement
- P-Mitrale - if P wave is wide and/or looks like an M, think LA enlargement. Can be 2/2 mitral stenosis/regurge.
- P-Pulmonale - if P wave is taller than >2.5mm in II, III, or aVF (big P), think RA enlargement. Can be 2/2 pulmonic stenosis or pulmonary HTN.
c) Ventricular Hypertrophy
- Cornell Criteria for LVH (sensitivity = 22%, specificity = 95%)
- Men: S in V3 + R in aVL >24mm
- Women: S in V3 + R in aVL >20mm
- Sokolow-Lyon Criteria for LVH
- Add the S wave in V1 plus the R wave in V5 or V6.
- If sum is >35mm → LVH.
d) Blocks
Look for AV block, RBBB, and LBBB. For AV block:
- 1st degree: PR prolongation.
- No intervention required, but could be a sign of something else.
- 2nd degree, Mobitz I (aka Wenckebach): Progressively prolonged PR followed by dropped beat.
- No intervention required, but could be a sign of something else.
- 2nd degree, Mobitz II: PR is normal, but P is intermittently followed by QRS.
- Can rapidly progress to third degree. Pacemaker is definitive treatment.
- 3rd degree: No association between Ps and QRSes. ("March out" each rhythm, should have different but regular rates.)
- QRS is often (but not always) wide, indicating idioventricular rhythm.
- Pacemaker is definitive treatment.
BBBs: Should be evaluated for any wide QRS rhythm. A mnemonic is WILLIAM MARROW:
- RBBB?
- If V1 looks like W and V6 looks like M, then it is LBBB.
- LBBB?
- If V1 looks like M and V6 looks like W, then it is RBBB.
The M (aka "bunny ears") is easiest to spot, if it's there. But it may be obscured by other phenomena, in which case: look for evidence of the right half of the M, which is the upright R' wave signifying delayed (myocyte-to-myocyte) depolarization of the respective ventricle. If you see it in V1-V3 (R-sided leads) → RBBB. If in V4-V6 (L-sided leads) → LBBB.
Ventricular pacing is mechanistically equivalent to a LBBB. QRS morphology changes without QRS widening signify an incomplete BBB.
6. ST-T Changes
a) ST Elevations?
Always compare the ST segment with the TP segment (not the PR!). The standard criterion is >1mm in 2 anatomically contiguous leads, except for V2-V3, for which ~2mm is required (varies by age and gender).
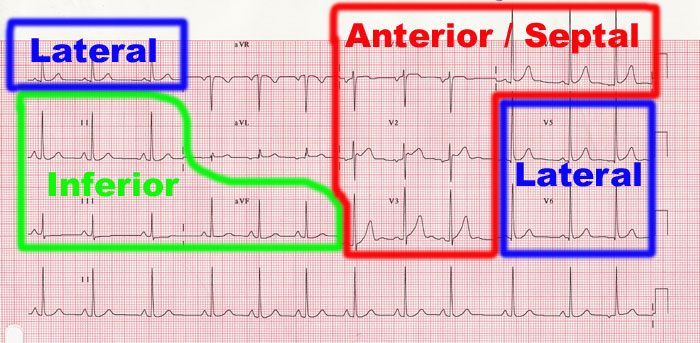
Anatomic groups
When scanning for ST changes, see if they correspond to anatomic coronary artery distributions. For ST elevations, find the zone with the highest elevations; for acute STEMI, this would be the most likely infarcted vessel.
If LBBB: Use the Sgarbossa criteria
Compare the direction of the QRS with the direction of the ST displacement. If they are in the same direction, this is called "concordant" (usually abnormal). If they are in different directions, this is called "discordant" and is normal unless it is an ST elevation ≥25% the depth of the preceding S wave. The full Modified Sgarbossa criteria are as follows:
- Any lead with ≥1 mm of concordant ST elevation
- Any lead in V1-V3 with ≥ 1 mm of concordant ST depression
- Any lead anywhere with ≥ 1 mm STE and proportionally excessive discordant STE, as defined by ≥ 25% of the depth of the preceding S-wave.
For more details on the criteria and rationale, see Smith SW et al., Ann Emerg Med 2012.
b) ST Depressions?
If you see ST elevations, look for corresponding ST depressions in all leads, and vice versa. Typically, myocardial ischemia will create "reciprocal" ST depressions in addition to ST elevations. A useful mnemonic is PAILS:
- P: posterior
- A: anterior
- I: inferior
- L: lateral
- S: septal
To use it, find the anatomical group with the highest ST elevations, and the the next letter in the mnemonic is expected to show ST depressions, as it is the electrically opposite group.
If you see ST depressions in all distributions, but ST elevations in aVR, consider left main coronary artery occlusion
c) T Wave Inversions?
In young adults (<25 yo), TWI's in V1-V3 are considered normal. In aVR, TWI is always normal. In older adults, TWI in any other lead may signify old MI (correlate with prior EKG and history); if TWIs are new (or prior EKG not on hand) and pt has acute symptoms, should consider ACS.
- Persistent TWI's in V1-V3 in adulthood could suggest R-sided cardiomyopathy, ischemia, or Brugada syndrome.
- Deeply inverted or biphasic T waves in V2-V3 with recent chest pain suggests Wellens' syndrome, i.e., critical stenosis of LAD. Requires PCI within 24-48hrs; do not stress test this patient!
d) Q Waves?
Defined as any negative deflection that precedes an R wave, regardless of what lead you are reading.
- Ignore III and aVR when interpreting Q waves.
- Small Q waves in most leads are normal (<1mm wide, <2mm tall). Anything larger is abnormal.
- Q waves of any size in V1-3 (precordial leads) are abnormal.
Normal Q waves are caused by the left-to-right depolarization of the interventricular septum, which occurs right before LV depolarization because of the septal fascicle of the left bundle branch.
Abnormal Q waves suggest a change in septal depolarization or overall ventricular depolarization. Think: New or old MI, cardiomyopathies (HCM, infiltrative), extreme rotation of the heart (normal in newborns), LBBB, WPW. For a longer explanation, see this slide deck.